It can be a bit daunting to write up your experiment once you’ve done it, especially with the weirdly worded marking rubric and the challenge of explaining why you may have done things in a peculiar way. But fear not, for this guide should help you write up a killer IA in no time, with examples from my project along the way!
It should help you tick off everything in the mark scheme – just follow it step-by-step and most of the hard work will be done for you automatically. Remember to not copy my IA idea or some of the words I use… word-for-word because the IB dishonesty ban-hammer is omnipresent.
Of course, this isn’t the only way to write an IA but I think it’s a pretty fool-proof way to make sure you hit as many of those 24 points you can.
Introduction and Background Theory
1) Explain why you chose this specific investigation and why it’s personal to you, but you don’t need a “When I was five…”
2) I would just make the title of your IA your research question, structured with a clear “How does the IV affect the DV”. Then you can justify your methodology in the introduction (usually this involves saying why you chose this method over another to measure your dependent variable or alter the independent variable).

3) Next it’s time to hit them with some background theory! It does not have to be crazy. Most importantly it must be über-specific to your research question and not just be a paragraph from your IB textbook.
Imagine you’re trying to explain to your classmate i) Why your experiment should work (why does acid break starch, in my case or e.g. why does temperature increase the rate of your reaction) and ii) How you are planning to measure your variables to support that hypothesis.
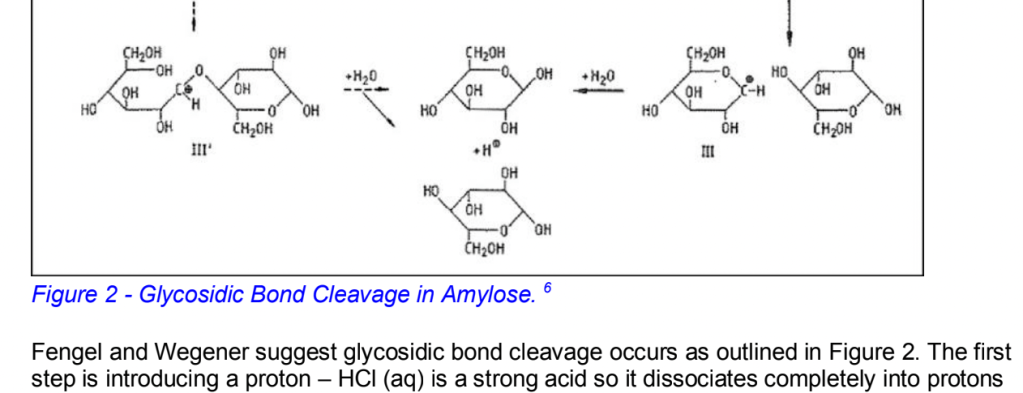
But the key thing in this section is to pretend you’re an academic and find some similar experiments online (try Google Scholar) and reference what they did. Again, it has to actually be relevant. But the point is it makes it seem as if you are contributing to a field, and that’s pretty dope! I got to include some fancy diagrams to show a proposed mechanism to the reaction I was investigating, for example.
Methodology (Exploration)
1) Hopefully you get a chance to do a trial run of your experiment or something vaguely similar before you were let loose on all the chemicals. It’s fine if it goes a bit wrong – it’s probably actually a good thing because you can write a lot of stuff the IB will reward you lovingly for. It’s actually this part where you show personal engagement (not childhood stories).
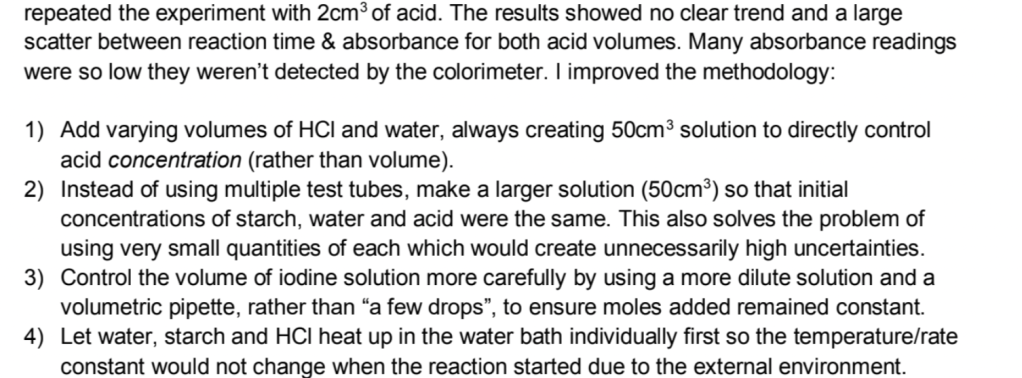
Explain how you changed up the quantities you chose, how many repeats you did, how you set up the equipment in an innovative way, the ranges of your variables. Extra brownie points if you can tell them how any of these may reduce the systematic errors (especially if you had to change your whole methodology).
I essentially got to write a whole page about my faults because my experiment trial run straight up did not go so well.
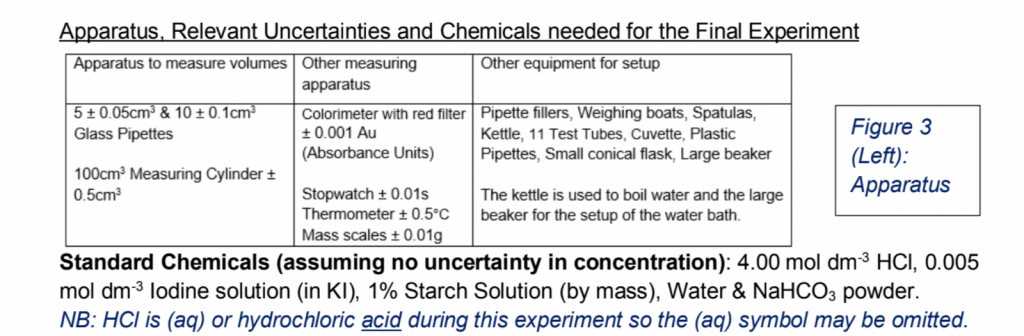
2) Next up is to introduce what chemicals (including their concentrations/moles/volumes) and apparatus you’re gonna use for the final experiment. Include the uncertainties associated with the apparatuses here, lest you forget the numbers later on. The best way to do this is in a table.
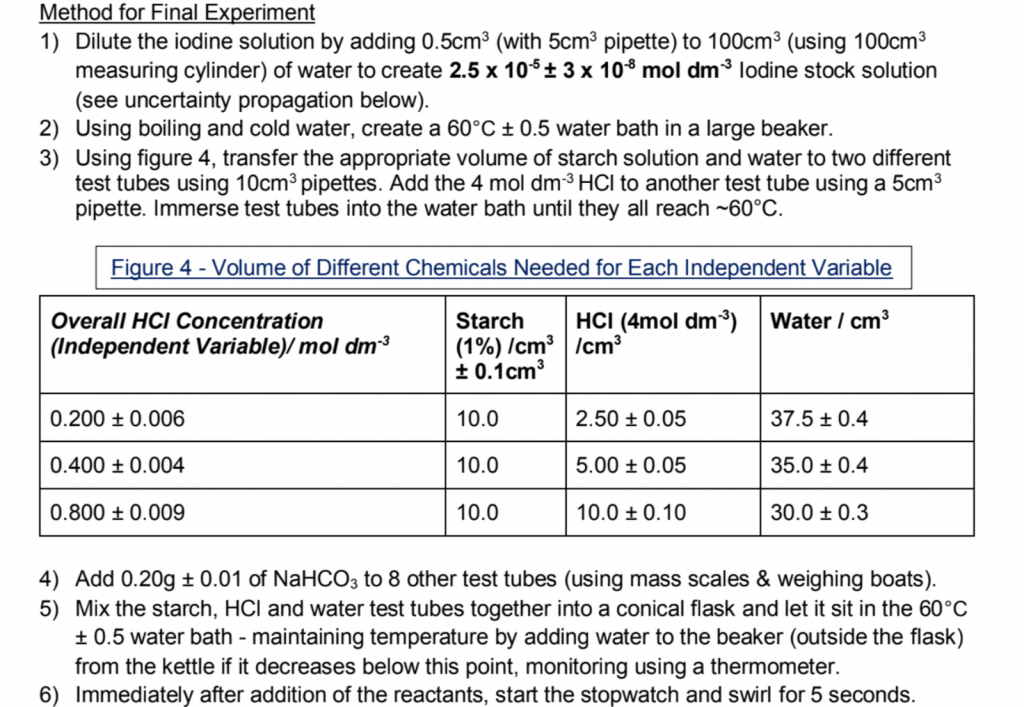
3) Then go ahead and write up the method you actually used in your final experiment, using numbered step-by-step instructions. You probably will have to use some numbers in this section and sometimes this can be complicated – for traffic light/equilibrium reactions or similar ones you may be changing multiple concentrations to yield the same volume of solutions and the best way to present this would be in a table.
Make it seem as if you’re doing enough experiments and repeats (usually 3-5) that this makes up 4-6 hours of lab work, as the IB expects and, even if it didn’t work out, emphasise that you did as much as you could in that time frame to collect a sufficient data set to support your hypothesis.
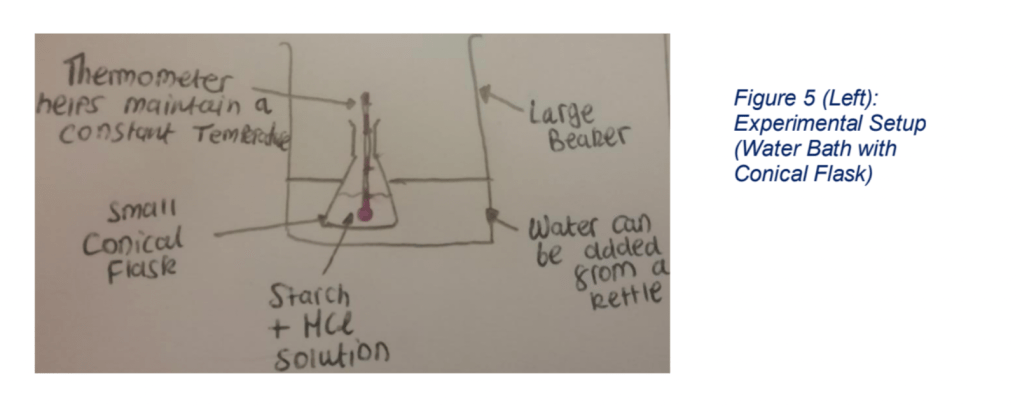
4) You won’t get brownie points for spamming your assignment with selfies you took in the lab. It’s more professional to sketch out your equipment setup if it needs a bit of explaining in the typical pre-GCSE way (like drawing a three-line tripod for a bunsen burner) otherwise ditch the pictures/figures entirely.
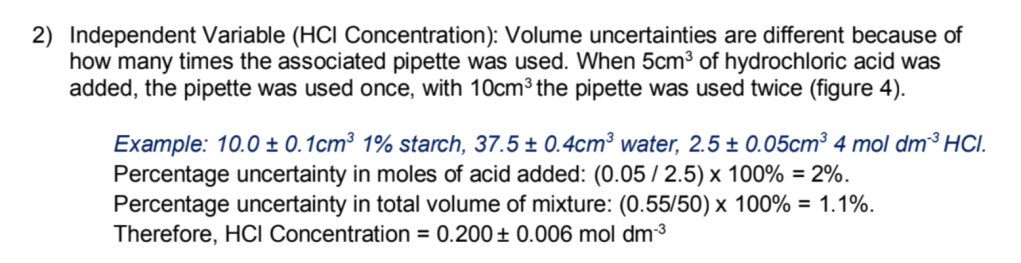
5) If you’re doing a bit of a complicated experiment, chances are you are going to have to do some fiddling around with the uncertainties of your independent, dependent and possibly even control variables. This is a good place to introduce them, as well as re-state your independent and dependent variables clearly. If you had to dilute a solution or had to use pipettes a different number of times for different solutions, uncertainties for the same variable could be quite different and things can get pretty yucky. In this case, you don’t need to be exhaustive, but show the method you used to calculate the uncertainty for an exemplar concentration.
6) To get the highest band of exploration, you need to take into consideration “all or nearly all” the significant factors that can affect your data and present error. The fool-proof way to tick off this box is to do this next section really well – control variables. If you can’t actually control a variable for whatever reason, you must monitor it (e.g. so you can say ambient temperature stayed the same). You can take an entire page if you need to and the best way to do it is to come up with at least five and put them in a table like this:

7) Great! You’re almost done with this bit. There’s a pesky bit in the Exploration section you need to hit to score well here, but it’s easy to do in a few sentences – “The report shows evidence of some awareness of the significant safety, ethical or environmental issues that are relevant to the methodology of the investigation”
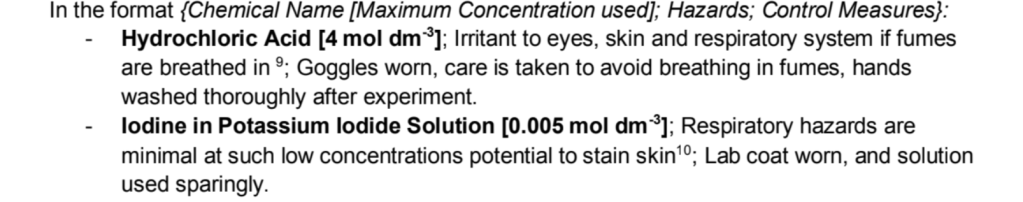
- Safety. For this bit, state basically every chemical you are using and its maximal concentration or mass in your experiment. Then look up the hazards using CLEAPSS and reference them (just search the relevant chemicals in the search bar), no matter how small (for harmless powders this can simply be something like respiratory hazard). You can also mention that you need to be careful about glassware and hot liquids. Then state what safety protocol you are going to take to minimise the hazard. 3 sentences each – done.
- You can tick off the environmental and ethical concerns in one sentence each. Mention how the chemicals are disposed so they minimise harm to aquatic life (usually via a chemical sink or thorough dilution) and you can say there are no major ethical implications apart from the usage of your schools resources/chemicals etc.
Results and Data Processing (Analysis)
WOO!! Now onto the bit where everyone changes their data but doesn’t know what the data was supposed to show in the first place and inevitably messes up by trying to show they didn’t mess up in the lab. Save yourself the trouble. If you think your results show the exact opposite of whatever you wanted, it’s ok. It makes for a more interesting second half of your report anyway, usually. Besides, the IB demands academic honesty! 🙂
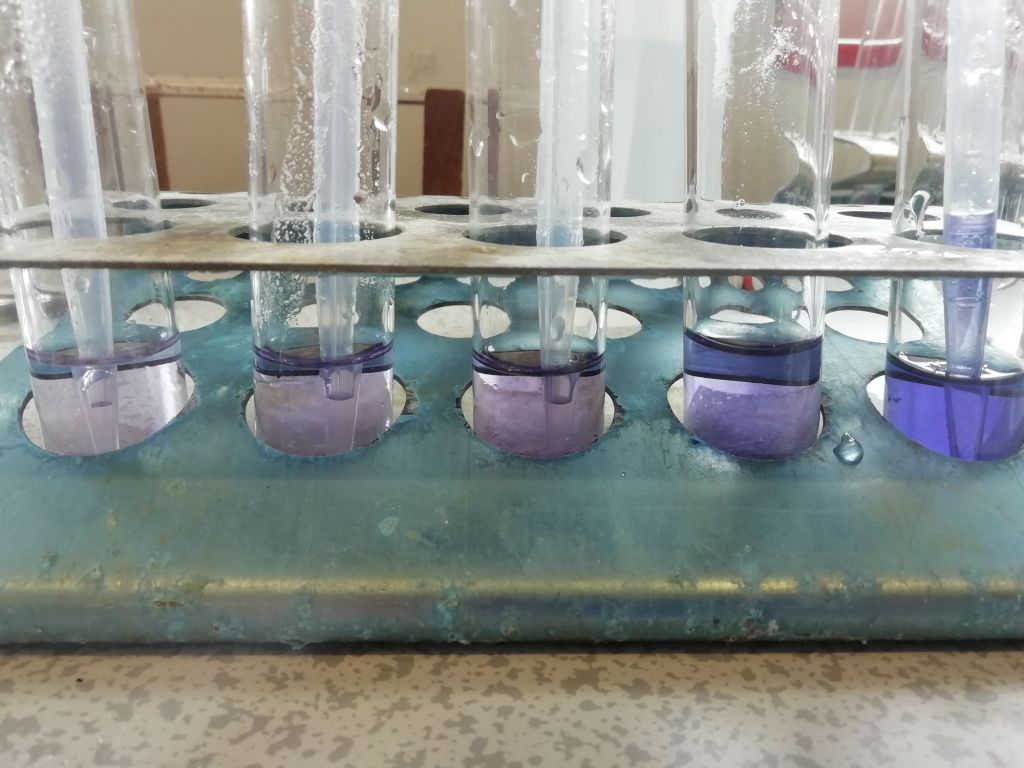
1) Qualitative Results. For some reason lots of people forget this, but you absolutely need it to get more than 2/6 marks in the Analysis section of the mark scheme! Just say what you saw (a color change or effervescense – a fancy word for bubbling). If nothing much happened you can always say the powder disappeared (or diluted if you’re a non-believer) or settled on the bottom. Again, you don’t need pictures unless they’re absolutely vital (you can always make it the feature image in your blog on how to write an IA in the future, anyway).
2) Quantitative Results. Present it as a raw data table. Invariably some of you will have pages upon pages of data and obviously you shouldn’t present all of this here – just take a snippet (nobody really knows if you should include all of the rest in an appendix at the end, but I would advise against having an appendix at all).
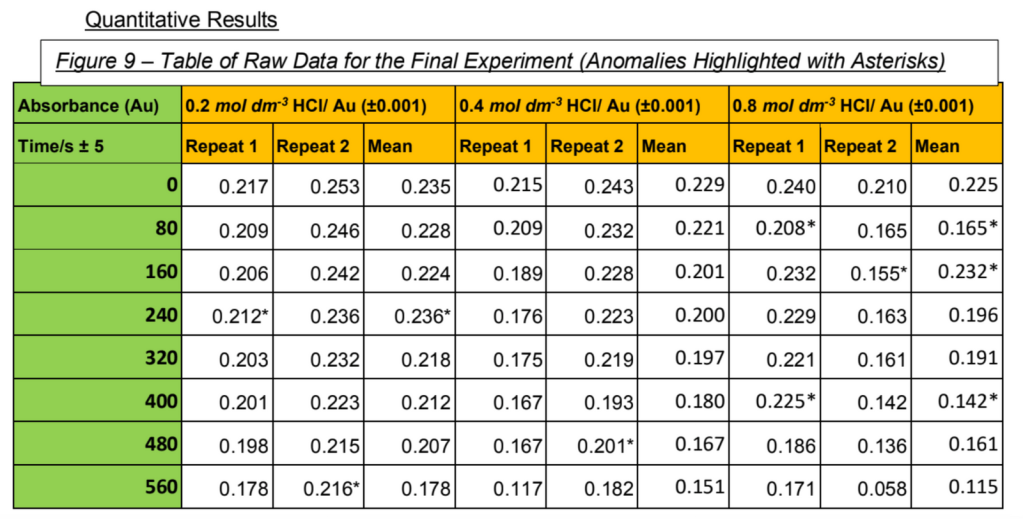
3) You can choose to do this after your graph but you need to discuss your anomalies and the major limitation of your experiment (maybe it was just that you didn’t end up doing enough repeats to generate reliable data). If you have enough data (which you almost 90% will NOT) you may introduce standard deviations on your data.
4) Look at this graph! Hopefully, you can generate a line graph with your hopefully non-categorical data. Remember the general pointers: the data should take up most of the space of the axes, a title, error margins/uncertainties on both of the axes and best fit lines or curves, as relevant. You can also pop in a R^2 value (Excel will do this automatically for you if you ask). Again, if you have enough data you can pop in error bars, but you don’t need them (much to biologists’ upset). You can circle your anomalies if it makes them clearer.
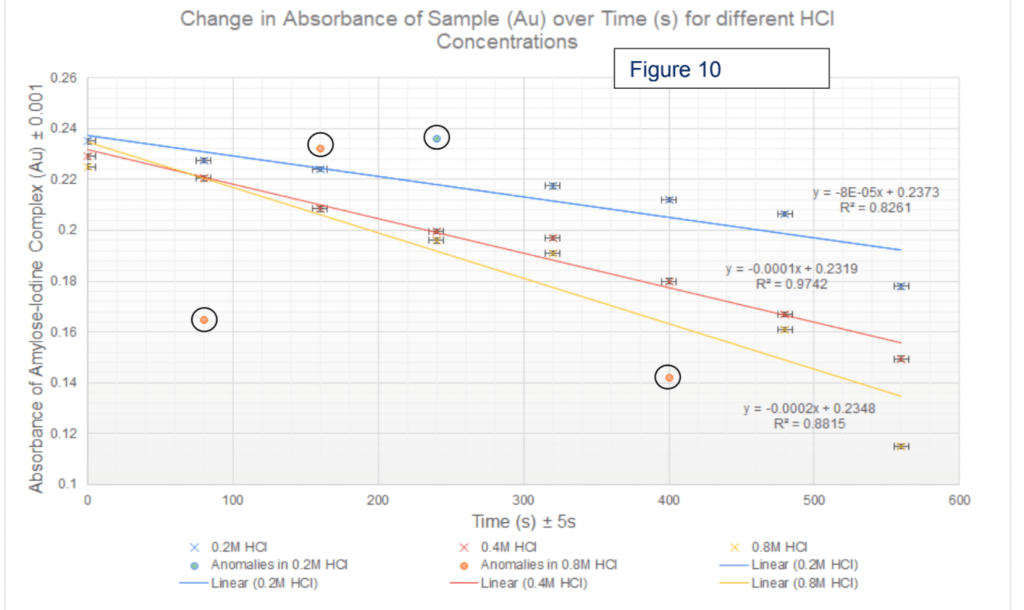
5) Describe your graph simply e.g. “negative linear correlation” and comment on the R^2 values (these show how well the trendlines fit the data you gave). Comment on how many of your points were anomalous and what you would have expected from the literature data value/literature explanation/previous experiments/hypothesis (in a descending order of preference). If there is a literature value, you can work out a percentage error.
6) Conclusion! My graph shows that …… this makes sense/doesn’t align with my hypothesis because ….. One exception to this was …..
K.I.S.S – Keep it simple, silly!
7) Data processing. This will REALLY depend on the experiment you performed, but you need to do some sort of rigorous calculation or technique that is relevant to helping you answer your research question. The IB care a lot about the accuracy of your calculations and the maintenance of an appropriate degree of significant figures.
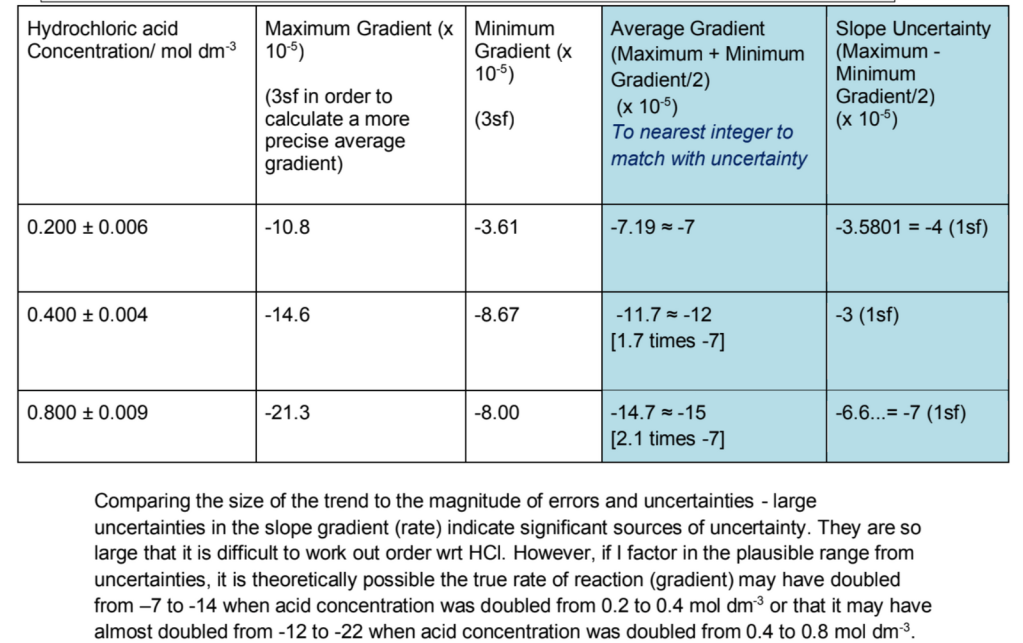
If you had a graph, a good way to do this may be to use Min-Max error processing to see how big your final uncertainties actually were (this is different to the uncertainties you had already measured and stated previously). You can just show an example of how you did this if you had multiple lines and then present the results in a table.

A few extra tick marks to make sure you fulfil in this section are:
- Comparing the size of your trend to the magnitude of your uncertainties and errors
- Whether there was actually enough data to make a solid conclusion
- Whether your control variables tampered with your final results
- How closely your repeats were to each other (i.e. precision) – this affects how valid your conclusion may be
- Being honest and critical! More on this in the next bit….
Judgin’ and Extendin’ (Evaluation)
You’re probably on the last page or so of your write-up now and it can be tempting to say that you can just improve next time by completely changing your methodology to use fancy, expensive apparatus or just do a billion more repeats but this is a section that is actually really important. In just a few paragraphs you can score up to a third of your total IA mark!
1) Evaluate your strengths. Maybe you kept the room the same temperature, that’s worth something! You can say even these can be improved farther e.g. using draft excluders.
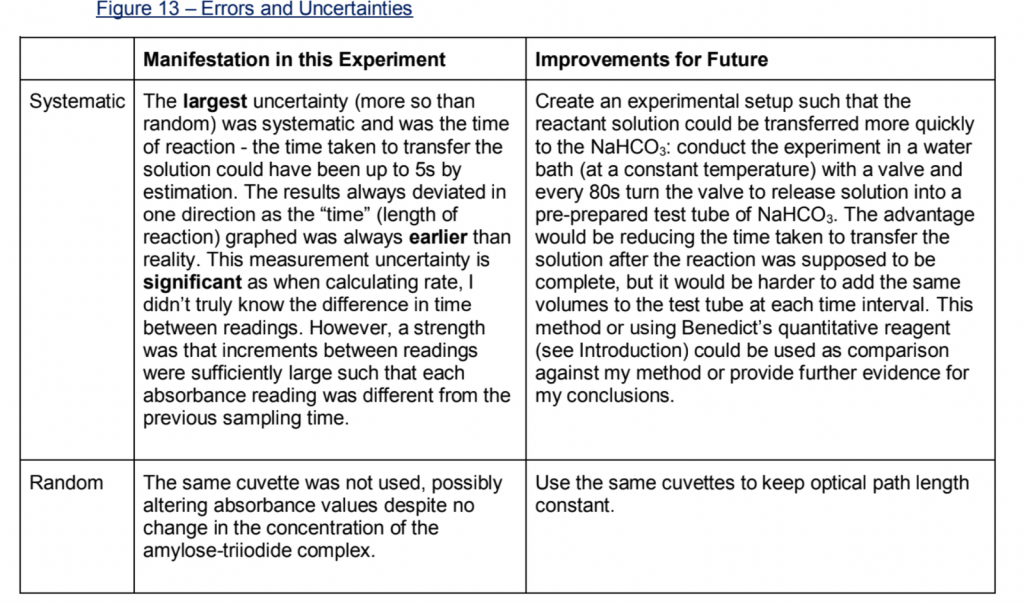
2) Evaluate your weaknesses. There probably were inevitably some human and random errors and these are worth a mention. However, the main point of this section is highlighting the unavoidable systematic errors that arose from your methodology and how improvements could be made to minimise them if you were to do it all over again. If you’re struck for ideas mention more precise apparatus, a bigger sample size or a larger range for your independent variable. Also ensure to compare how big systematic vs random errors were in impacting how strong of a conclusion you could have made. Again, I would use a table:
3) To finish up, write a sentence suggesting a similar but realistic experiment that could be useful, usually to explore a similar topic e.g. if you investigated glucose, you could try looking at galactose next time.
Communication
YOUR IA SHOULD BE NO LONGER THAN 12 PAGES.
If it is, the first step is to cut out the fluff. Please be careful with changing table margins (though having things tabulated in the first place can save some valuable space, hence why I used so many) and font sizes/spacing. The IB don’t like this.
You can also save space by not being silly. You don’t need a page long bibliography at the end: it is perfectly acceptable to use a footnote and numbers-in-text approach to referencing. Just keep it consistent and have the bare minimum like access dates for websites. Ask your teacher, but I really don’t think you need an appendix either – nobody knows if you will be penalised for it, but it almost certainly won’t be read if your IA gets externally moderated, anyway.

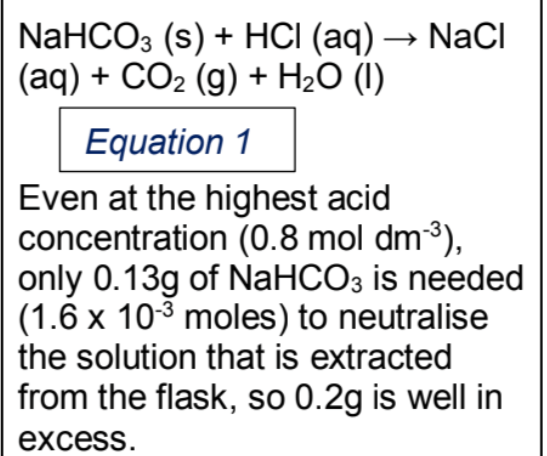
Make sure everything is anonymous, you have page numbers, all the graphs are labelled and it looks nice, large and pretty. Tables must have their relevant uncertainties (once in the column heading, unless they’re all different) and make sure your numbers have units. You can even number your equations if you used quite a few, otherwise treat everything else (even tables) as figures and number them accordingly. You can use a text box to do this.
The last check is finding anywhere in your IA you used the words accuracy, precision, reliability and error. Make sure you used all of them correctly and ask someone if in doubt. This really annoys teachers and moderators alike if you mess it up.
Congratulations! That’s one fine IA if I say so myself 🙂


Leave a comment